In May 2021, we collaborated with Mindshare (part of GroupM) on a project for one of Mattoni's brands – Magnesia mineral water. The project resulted in a 50% reduction in the cost of reaching a single OOH campaign audience member.
Read the full case study to see how using geolocation data helps estimate OOH campaign metrics and reach more people within the same budget.

Very often, the traffic data available on the market is outdated. Most companies planning OOH campaigns use it without fully realizing that traffic changes much more frequently than new studies are published. The outbreak of the pandemic is a prime example, as it drastically changed how Poles moved around the city within just a few days, and it continues to change—both in terms of preferred modes of transport and traffic volume.
The statistics offered by media owners regarding potential campaign reach contained too large a margin of error compared to the traffic realities of 2021. Therefore, Mindshare did not consider them a source of high-quality data.
Our goal was therefore to optimize the media grid based on current data to see what traffic levels actually looked like at selected points, which were approved as advertising locations for Magnesi. This was also the biggest challenge of the campaign.
Analyzing and providing data on actual foot traffic and its trends in a given location is the core of dataplace.ai's business. That is why we knew exactly how to solve our client's problem.

The campaign focused 100% on OOH outdoor advertising, primarily using CLP units, or citylights. They were chosen as the main type of medium because they guarantee a large audience—they are most often located at public transport stops or on sidewalks.
The goal of the campaign was to reach as many unique customers as possible so that the brand could increase its recognition and its product would be associated with water containing a high level of natural magnesium.
First, we addressed the issue of obtaining reliable traffic data in Poland. From a database of over 3 million mobile devices, our systems collected location information continuously (every few minutes), and then at regular intervals, computational models analyzed it to provide detailed and reliable results. Thanks to this, we identified the current routes taken by our subjects, and, thanks to machine learning, we were able to instantly find correlations between them every day.
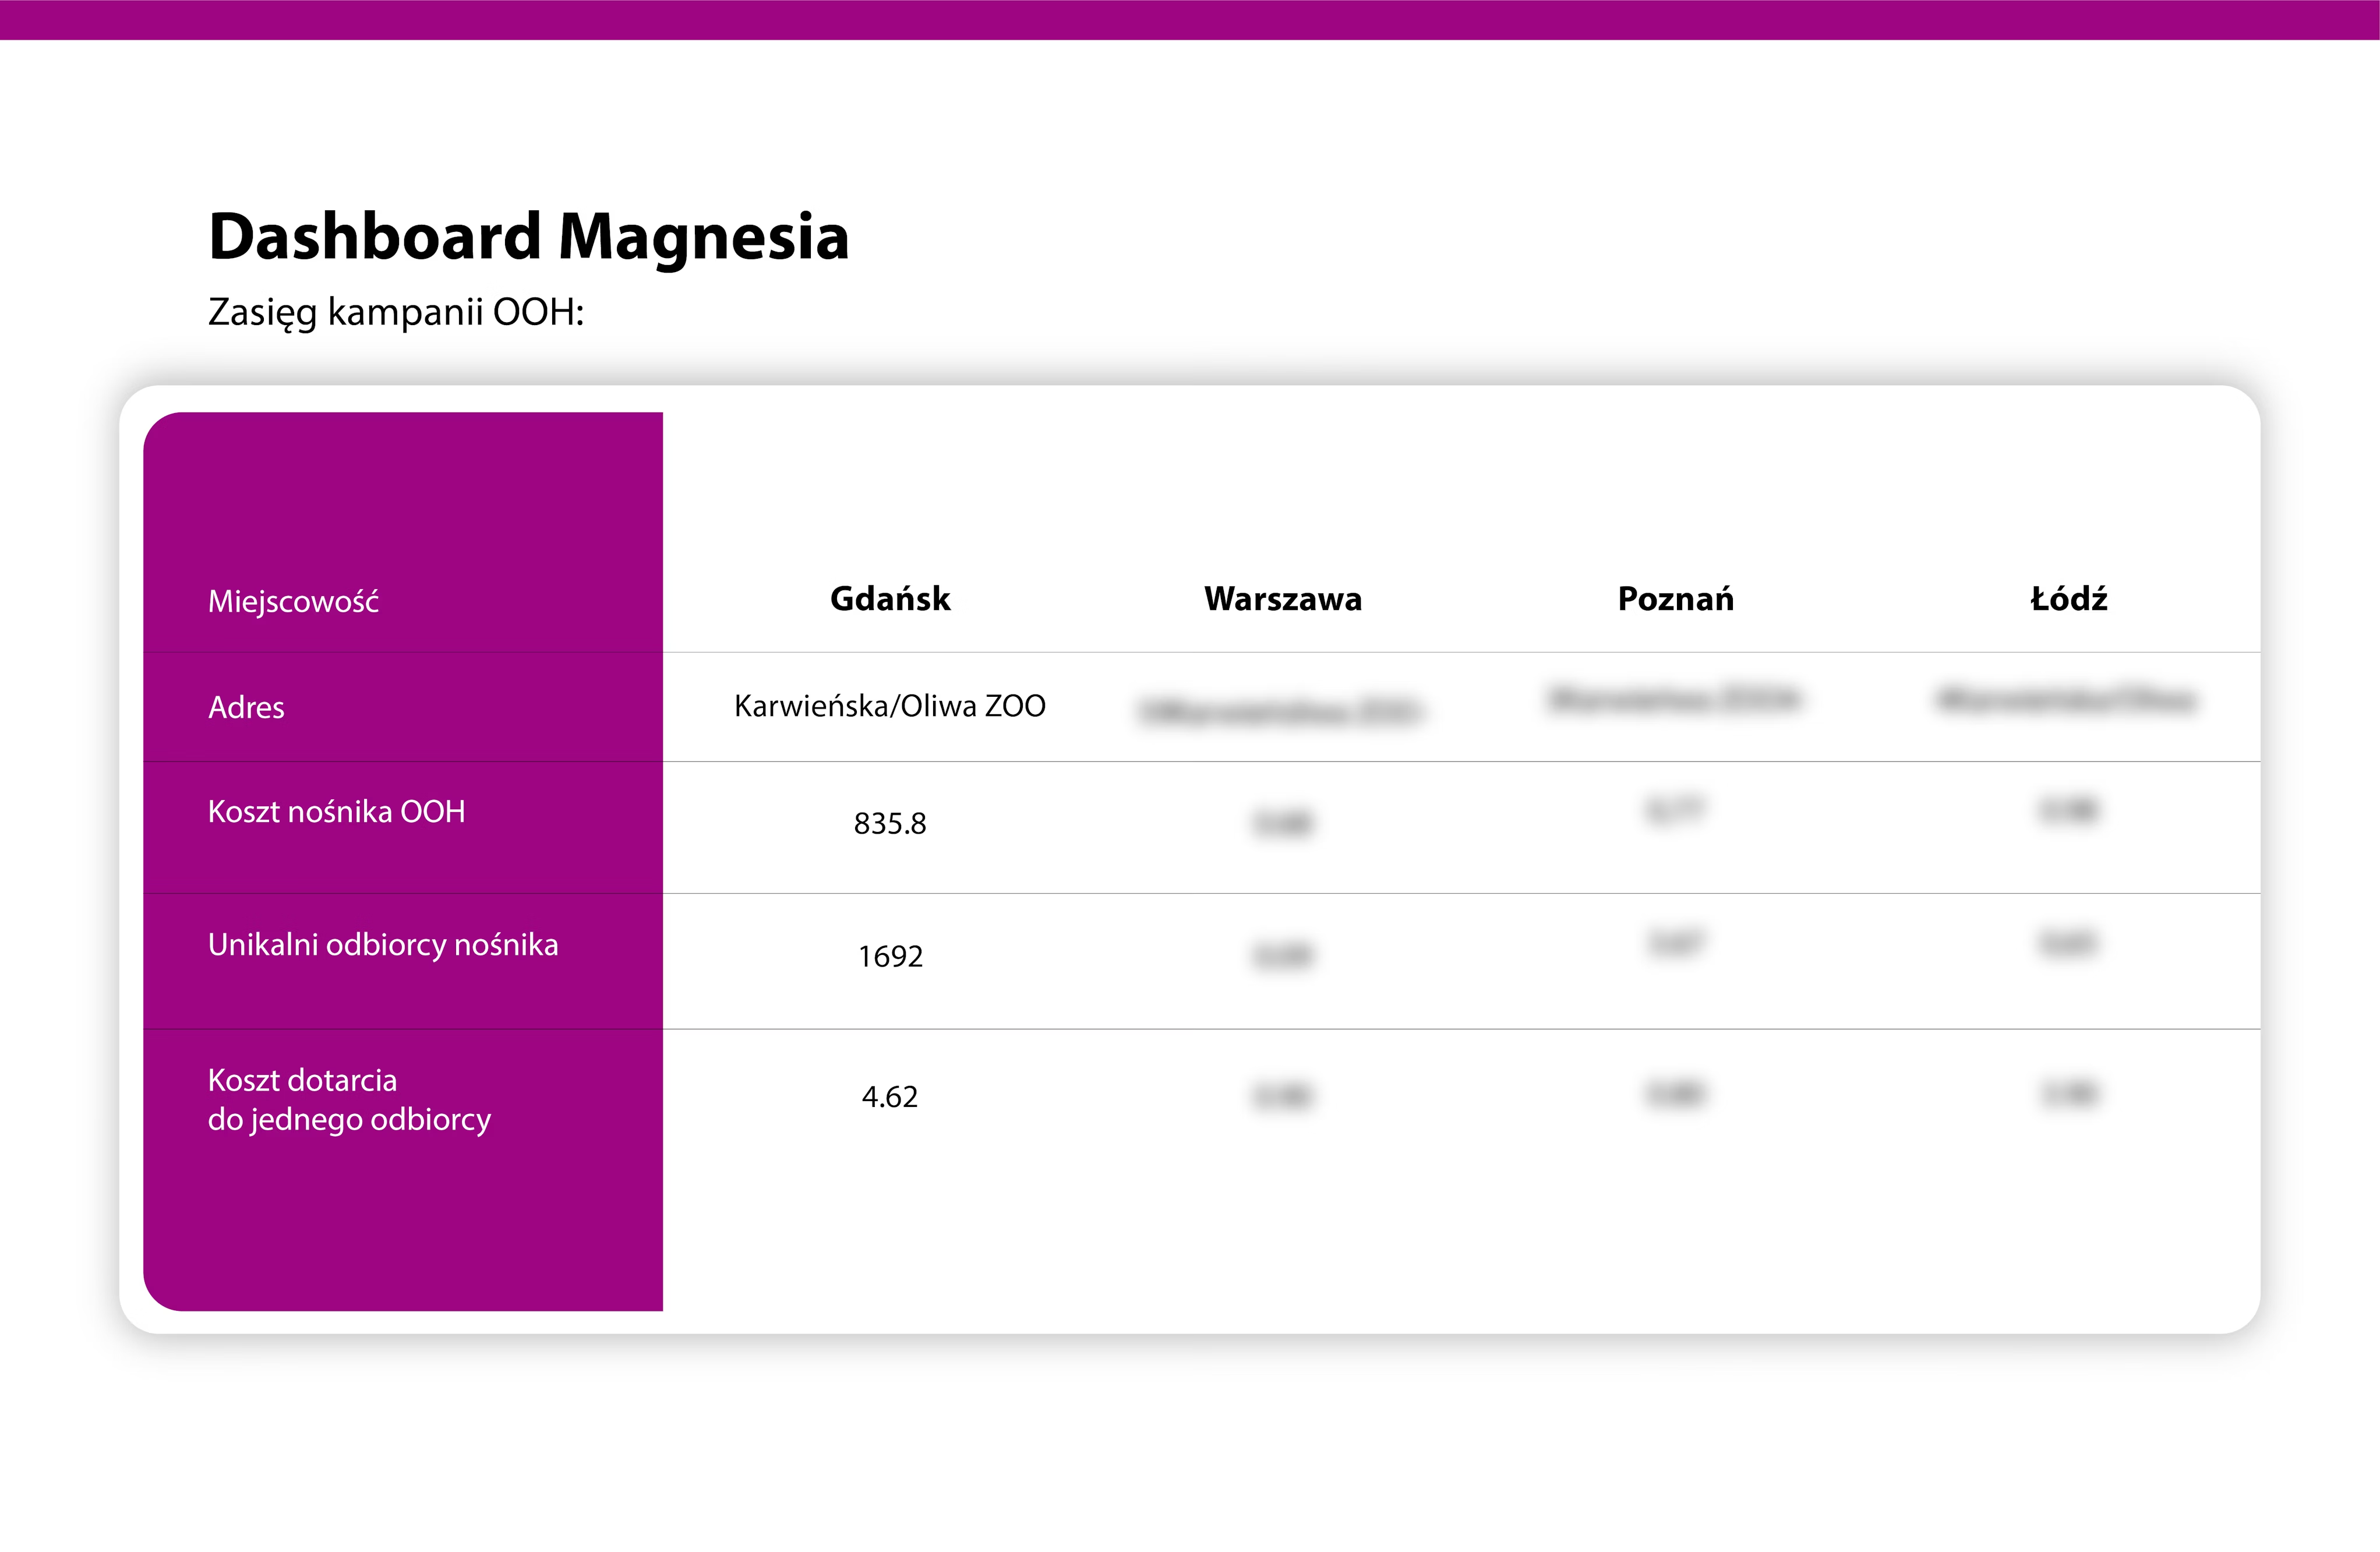
The next step involved overlaying data onto the locations where the advertising media were to be placed. This allowed us to estimate forecasts for criteria such as: campaign reach, average number of campaign contacts, and the cost per reach. Importantly, the campaign plan aimed to maximize ad reach among city residents, so in addition to traffic data, we developed a frequency matrix to check for reach duplication.
To ensure the most effective campaign in terms of reach while also reducing unnecessary costs, we decided to introduce a modification that accounts for how many unique viewers each medium and the campaign as a whole would have. In this methodology, multiple contacts by the same person were counted as one. This approach provides a better understanding of how many people we are actually reaching and whether the campaign is configured efficiently.
The results primarily allow us to assess which media contribute the least to the campaign and can be removed without significantly impacting reach. This translates into savings amounting to tens or hundreds of thousands of zlotys.
Additionally, we analyzed the campaign's geographic reach. This allowed us to understand which micro-regions the campaign reaches effectively and which were overlooked. A view of the coverage also made it easier to add further media in a way that maximized reach. Based on this, we identified the least effective media—those that offered the least reach or had the highest cost of building reach.

As a result, we were able to optimize the media network based on maximizing both reach and the cost of building it in each of the campaign cities.
Analysis results: All 234 campaign media were, as planned, concentrated in four cities. This meant that many of them unnecessarily duplicated reach, thereby increasing the cost per customer. Some locations reached a cost per unique customer acquisition that was 4x higher than the average.
Results: Thanks to analyses based on the current movement habits of Poles, we managed to increase the campaign's reach by removing the least effective media from the original plan (in terms of costs and reach duplication) and optimize the cost per reach by 50%!
Based on our analysis, we were able to improve campaign metrics by:
At dataplace.ai, we leverage data from various sources, which we then analyze using machine learning to better understand customer journeys and preferences in the real world.
– these are just a few of the many insights we analyze.
Our proprietary technology and tools intelligently and comprehensively integrate data from multiple sources to help you make better business decisions. Schedule a meeting and gain access to reliable data that will increase the effectiveness of your campaign.