


8 YEARS OF MARKET EXPERIENCE • CURRENT TRAFFIC DATA
Understand how the city moves

Current access to pedestrian and vehicle traffic data in every corner of the city. Access to current data every day, a complete picture of changes in real time.

Better decisions, lower investment risk, transparent analysis and visualization of traffic flows.
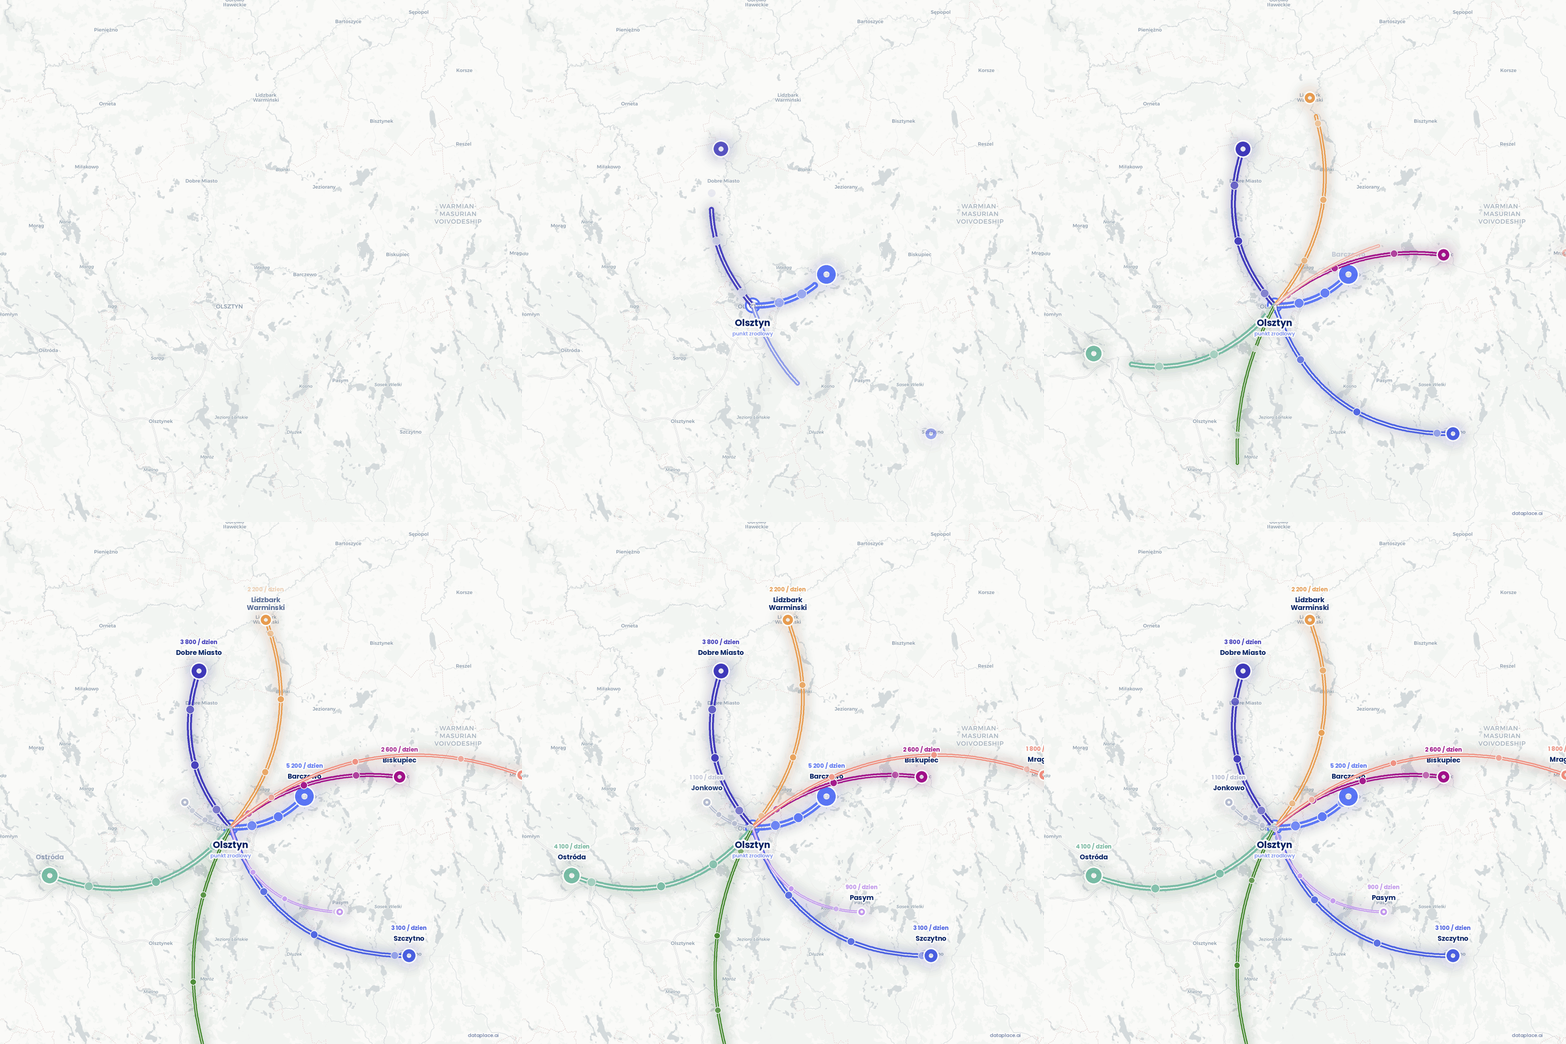
Mapa regionu warmińsko-mazurskiego z oznaczonym miastem Olsztyn i pobliskimi miejscowościami oraz jeziorami.
Join the largest companies in Poland and Europe that have trusted us:
Discover how people move
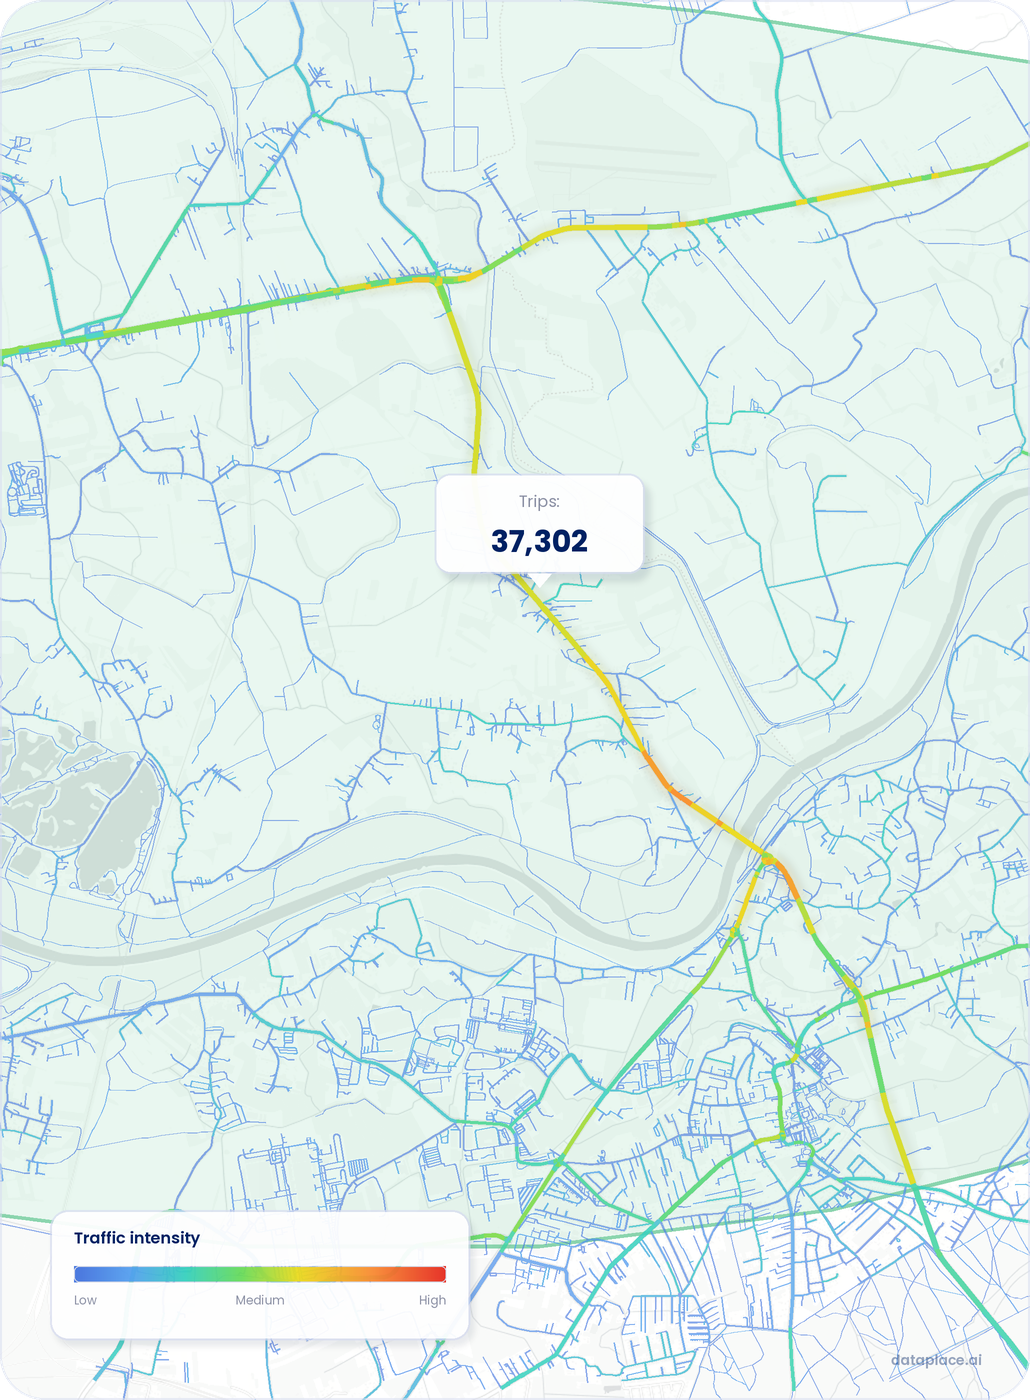
Mapa ruchu drogowego z kolorową skalą natężenia, pokazująca trasy o niskim, średnim i wysokim natężeniu, z wyróżnioną wartością 37 302.Mobile ScreenMobile ScreenMobile ScreenMobile Screen
1
Analyze traffic flows

Where do employees come from? Which neighborhoods generate traffic and which ones attract it? Do residents use the center or bypass it in favor of suburban galleries? Most cities do not have answers to these questions, and it is the flows of people that decide where to invest in infrastructure, transport and public services.

2
Data instead of intuition

Without current, objective data, every major investment decision — a new line of communication, reconstruction of an intersection, a change in traffic organization — is based in part on intuition. Reliable, up-to-date traffic and location analyses provide an objective basis for both investment planning and public consultation.

3
Up-to-date information

A comprehensive traffic study is an investment of several million zlotys. Warsaw, Wrocław, Cracow — each of these cities implements them once every few years. In between studies, decisions are made about transport, investment and space based on data that may no longer reflect reality.

Do you have any questions?

Book a meeting
Book a meeting

Book a meeting with us, we will be happy to answer any questions and show you exactly how to use our solutions.

Advanced technology for better decisions about the city

Rozwiązania SmartCity od dataplace.ai gives you constant insight into how locals and tourists are moving — from general trends to details at each location.

Observe changes in the city in real time

Follow how traffic changes in every corner of the city — from the main thoroughfares to the residential streets.

Respond to trends, verify hypotheses and plan ahead. Current data in real time, taking into account seasonality and distribution for working days and weekends.

Mapa z lokalizatorem na środku, pokazująca sieć zielonych sześciokątów na obszarze obejmującym ulice i parki.

Understand where people are coming from and where they are going.

Understand how people move between districts and municipalities, which neighboring towns they commute from, and where they travel from to attend cultural events.

Analyze traffic flows by pedestrian and vehicle movement, across different times of day and seasons of the year.
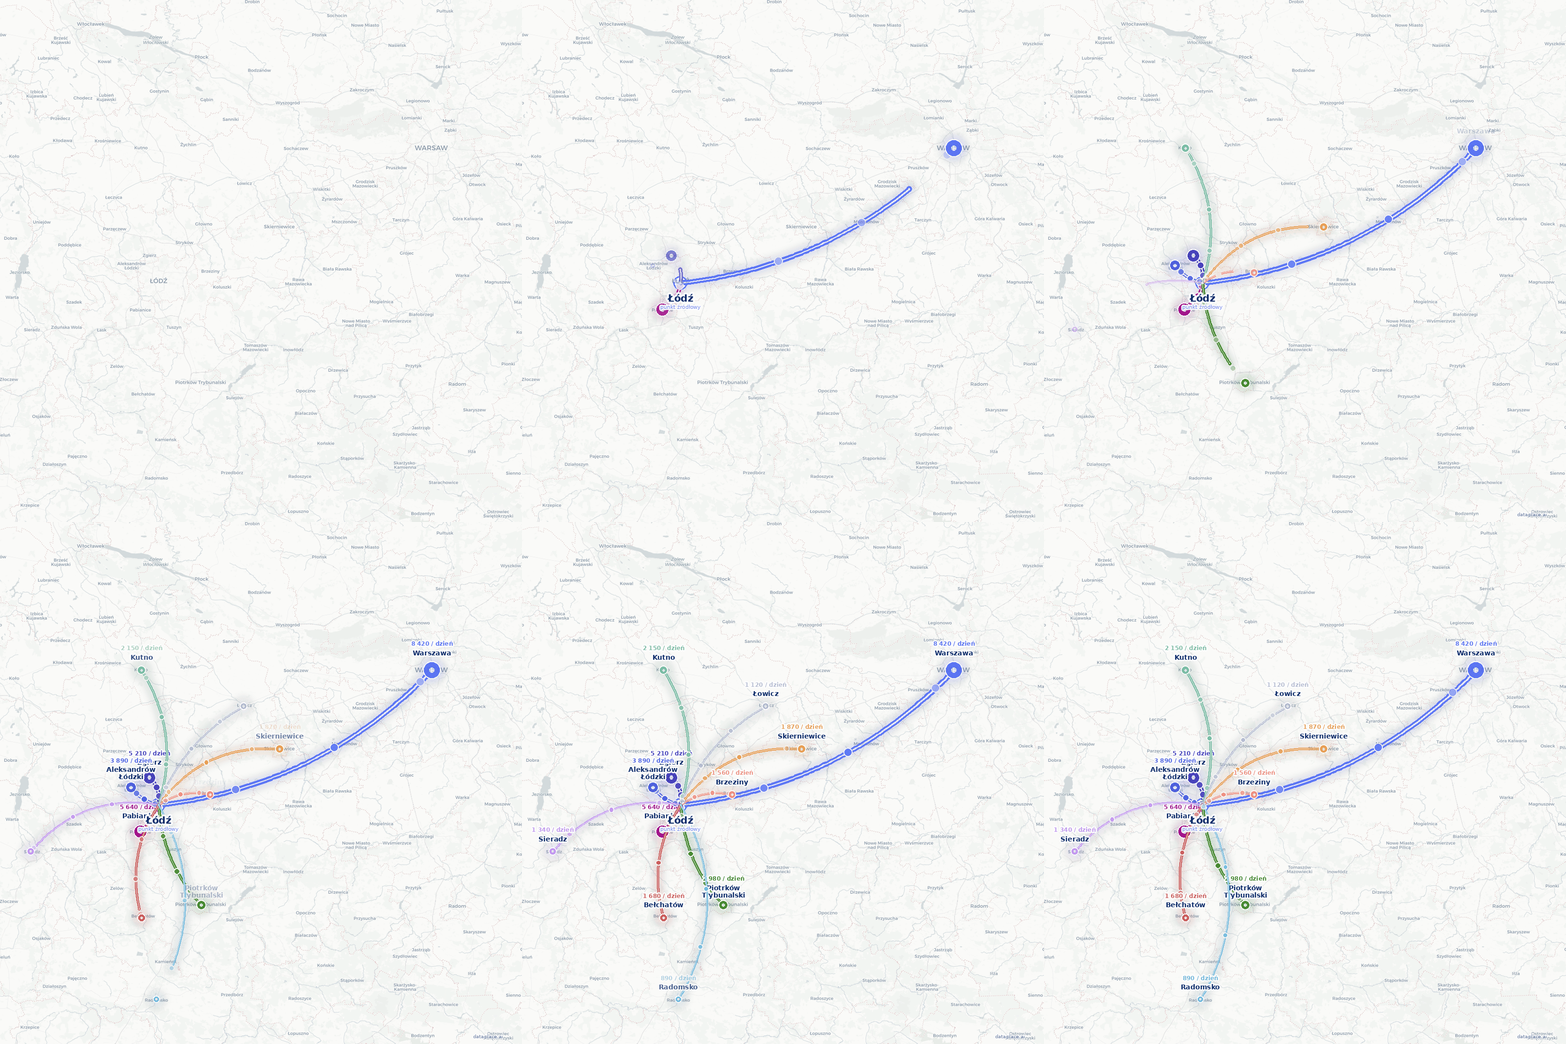
Mapa regionu centralnej Polski pokazująca miasta Łódź, Warszawa, Piotrków Trybunalski, Skierniewice i okoliczne miejscowości.

Invest where there is a real need

Identify "white spots" – areas where there is demand for specific services that are currently missing. Verify the potential of locations for planned investments.

Attract commercial and public services essential to local communities, from kindergartens and nurseries to bakeries and gyms – based on hard data, not gut feeling.
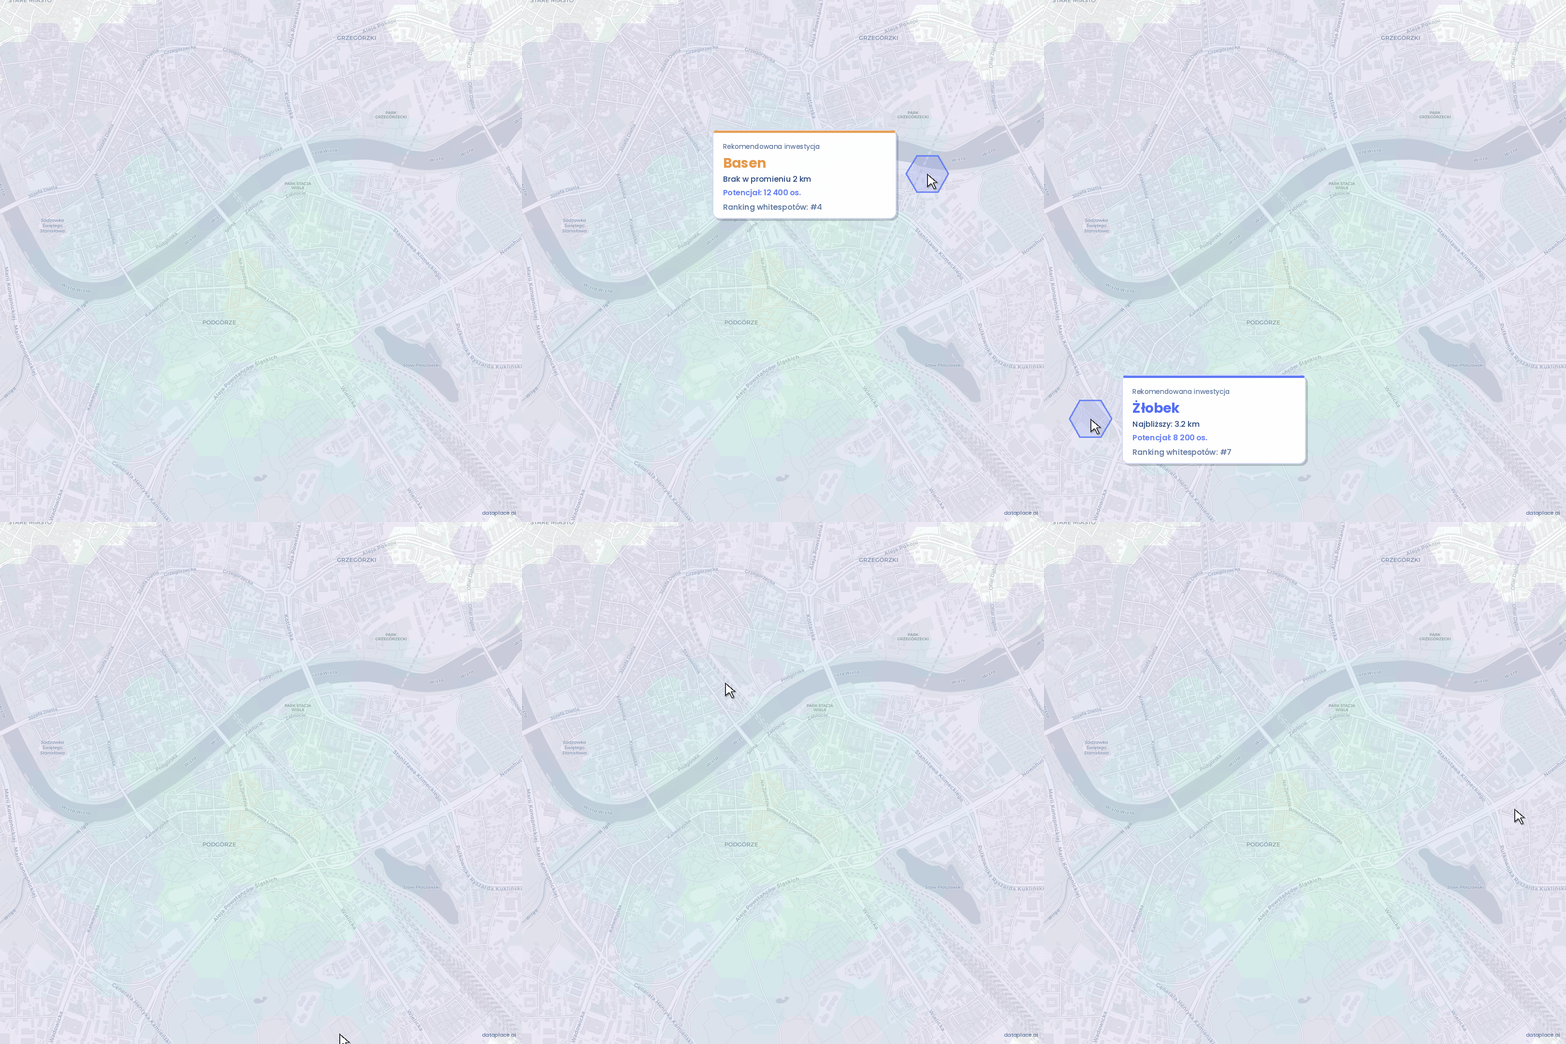
Mapa centrum miasta Krakowa, pokazująca dzielnice Podgórze i Grzegórzki oraz rzekę Wisłę przepływającą przez obszar.

Find out where your tourists are coming from and how they spend their time

Identify where your visitors are coming from, the routes they take, and whether your promotional efforts are actually driving growth in tourism from specific regions.

Discover whether tourists are sticking to the main attractions or venturing out to explore the lesser-known parts of the city.
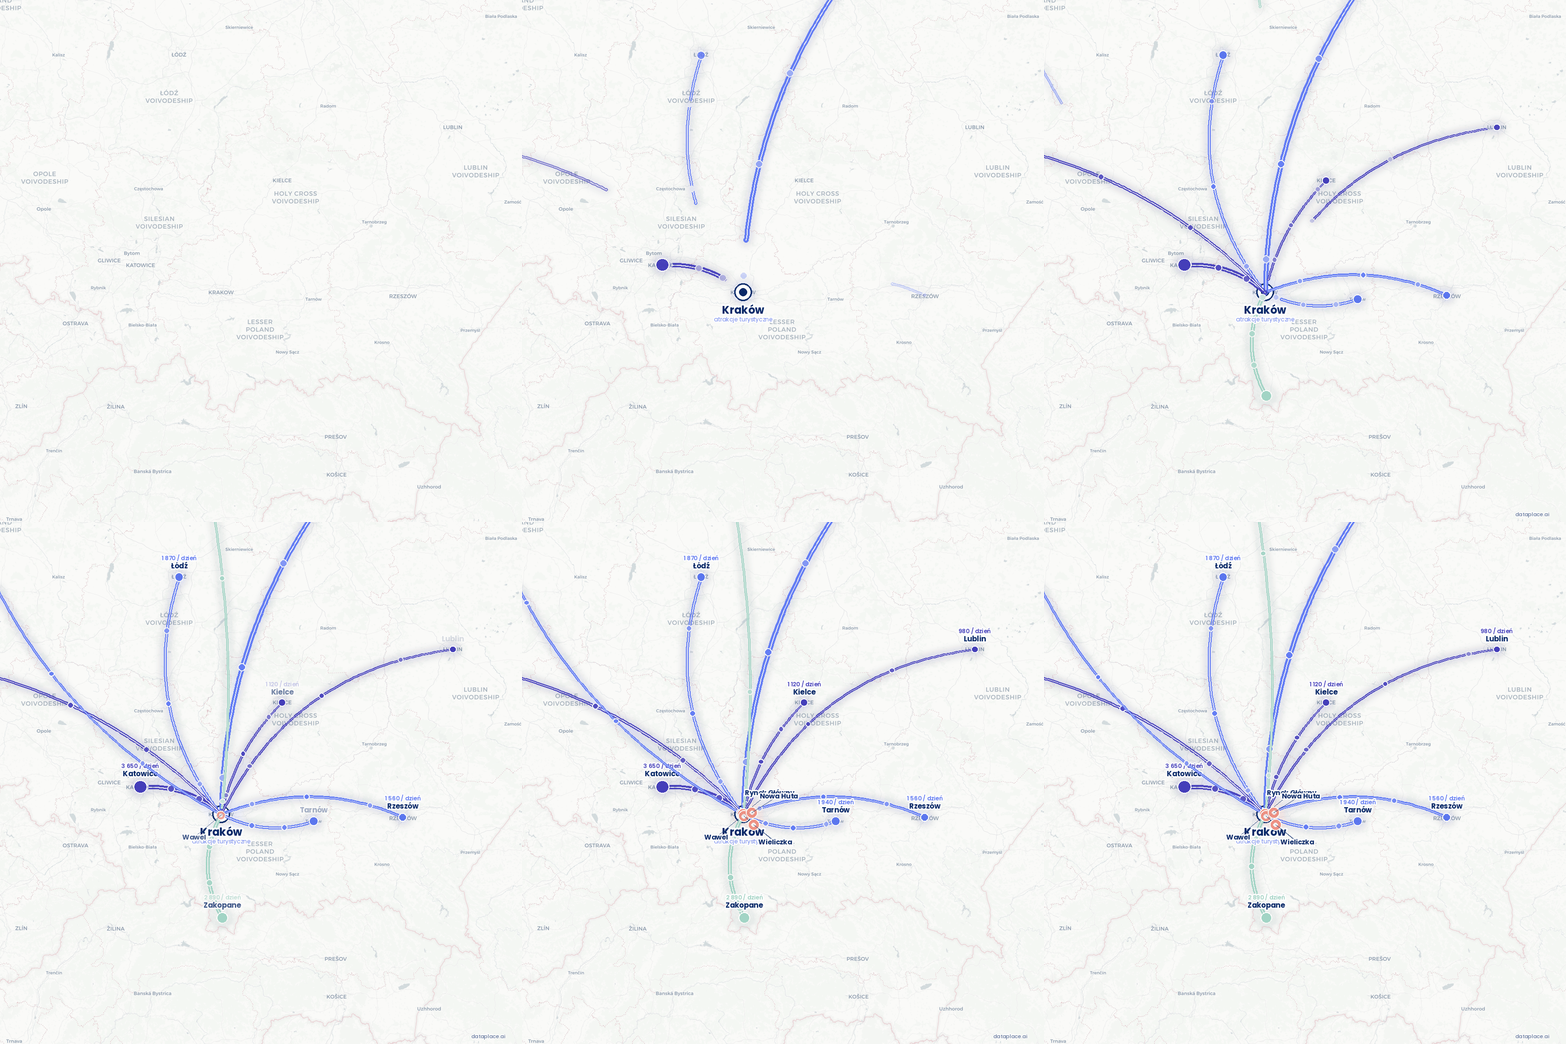
Mapa południowej Polski pokazująca województwa: łódzkie, śląskie, opolskie, świętokrzyskie, małopolskie oraz podkarpackie z zaznaczonymi miastami jak Kraków, Katowice, Kielce, Rzeszów.

Plan transport based on how people actually move

Optimize public transport routes and schedules to align with the actual travel patterns of residents.

Plan road construction and maintenance based on real traffic volume, whether for residential streets or major arterial roads connecting key areas of the city.
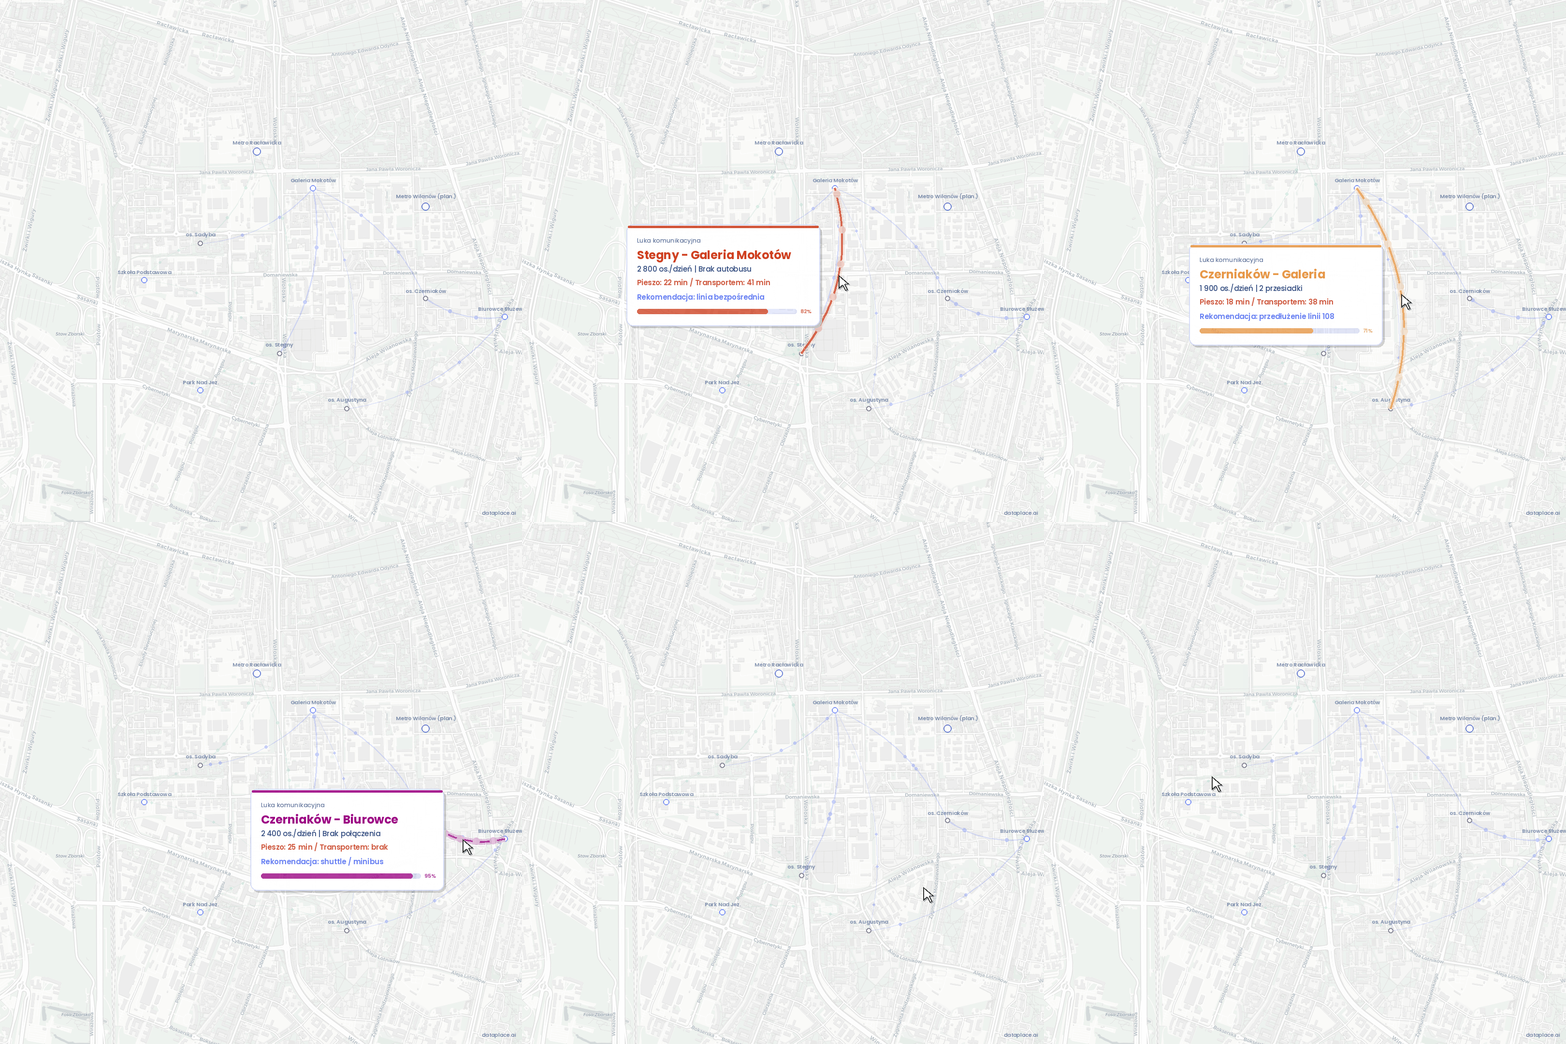
Mapa dzielnicy Mokotów w Warszawie z zaznaczonymi stacjami metra i osiedlami, w tym Galerią Mokotów, Metro Racławicka oraz planowaną stacją Metro Wilanów.

Technology proven by largest companies in Poland

For 8 years, we have supported the largest companies in the country with our traffic analysis – from retail chains, to banks, to media agencies. Now we are adapting the same technology to the needs of cities.
50+
active customers, including
global corporations
~90%
extrapolation accuracy verified
in the business environment
TRL 8
level of technological readiness – system tested in real conditions

FAQs

Are dataplace.ai solutions only for big cities?
How accurate is the data from the platform compared to a traditional traffic survey?
What departments and teams in the city hall can use the platform?
Can data be integrated with external systems?